POSNext has partnered with Looker, a top analytics platform, providing new ways to visualize your data using embedded analytics, dashboards and the ability to build custom reports.
The new reporting system will be rolled out to brokers starting July 12th.
Once updated, the dashboard has been updated with high level business overviews on current performance:
- Current unsold cost
- Current retail value
- Net Profit YTD
- Unshipped Orders
- Sales by marketplace
- Unsold inventory in the next 7 days
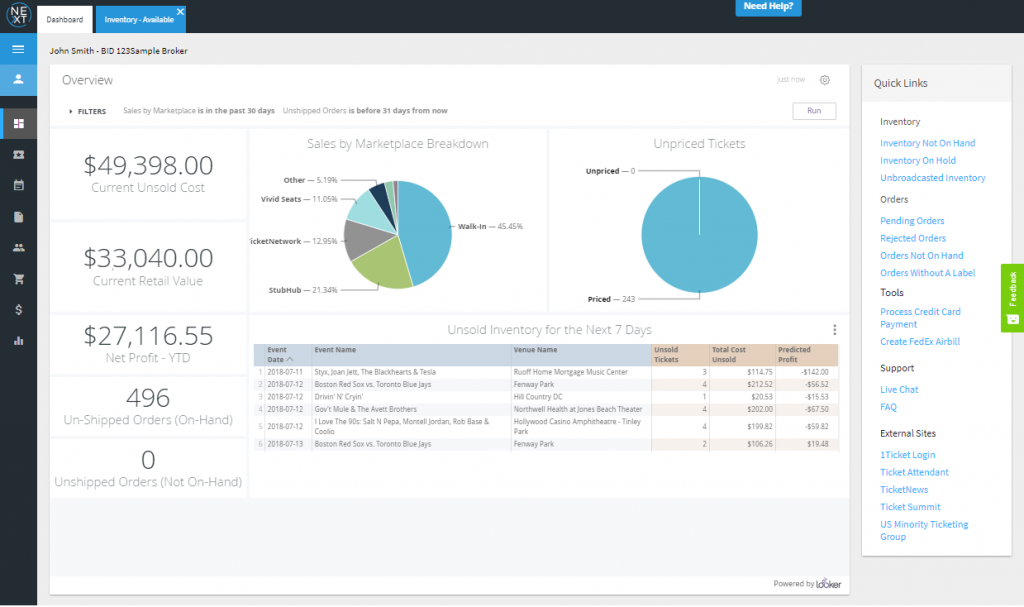
Drill-downs highlight individual tickets and orders and are clickable to take you to the specific order.
The old reports have been retired and replaced with fully redesigned reports. There are 15 reporting dashboards containing over 40 reporting points. Each report is exportable and printable, and contains customizable filtering.
Some highlights include:
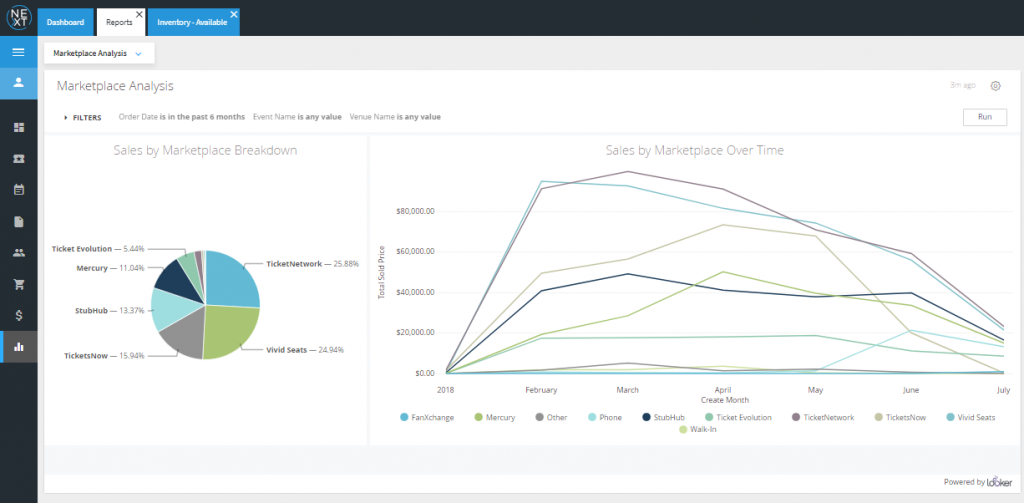
Marketplace Analysis – breakdown of sales by marketplace over time
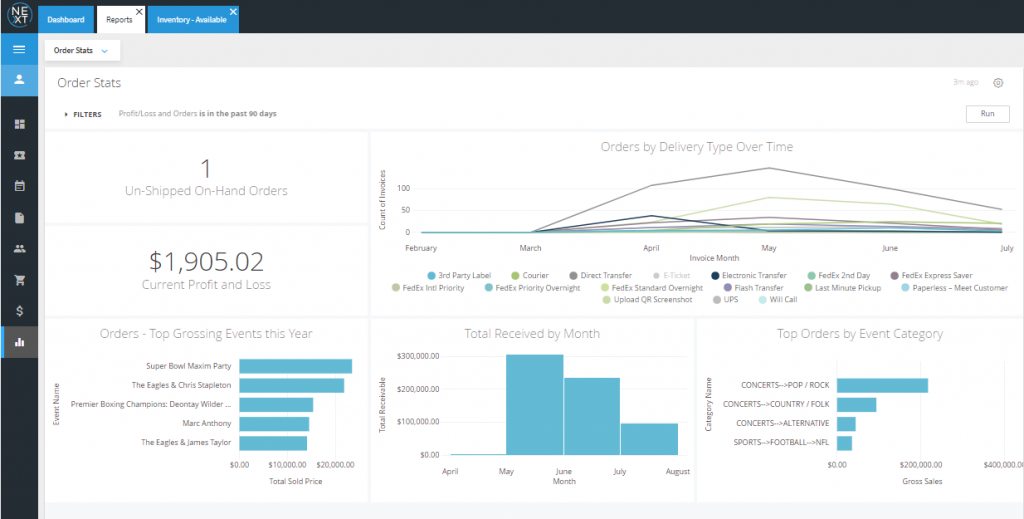
Order Stats – Provides high level summaries on recent orders
Other notable reporting dashboards:
- Business Summary
- Inventory -Profitability on upcoming events
- Inventory Stats
- Inventory – Wasted Stats
- Orders – Accounts Receivable by Month
- Orders – Orders by Customers
- Orders – Orders by Delivery Type
- Profit and Loss – By Event
- Profit and Loss – By Order
- Profit and Loss – Seat Profitability Analysis
- Purchase Order – Voids by Month
- Purchase Orders – Accounts Payable By month
- Purchase Orders – Purchases By Vendor